Introduction
If you’ve ever wondered why exam scores, human heights, measurement errors, or stock market fluctuations often seem to “cluster” around an average, you’ve already brushed up against the idea of a normal var—short for normal random variable. It’s one of those concepts that sounds intimidating at first, especially if your memories of statistics involve dusty formulas and confusing symbols. But here’s the truth: normal random variables are not just academic theory. They quietly power decisions in business, science, engineering, healthcare, finance, and even everyday life.
I still remember the first time I truly got what a normal random variable was. It wasn’t from a formula. It was from realizing that most real-world things behave in predictable patterns when you collect enough data. Heights don’t scatter randomly across the universe. Test scores don’t all pile up at zero or 100. Measurement errors don’t always lean positive or negative. They form a shape—a familiar bell curve—and that shape is the heartbeat of a normal var.
In this guide, you’ll learn what a normal var actually is, why it matters so much, how to work with it step by step, which tools make it easier, and where people commonly go wrong. By the end, you won’t just recognize a normal random variable—you’ll know how to use it confidently and correctly.
Topic Explanation: What Does “Normal Var” Really Mean?
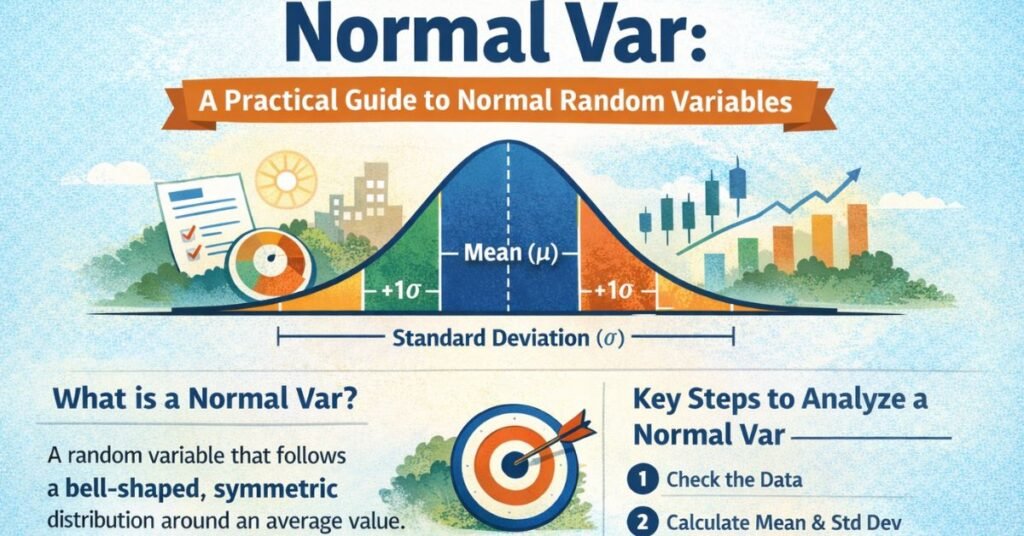
At its core, a normal var refers to a random variable that follows a normal distribution. Think of a random variable as a numerical outcome of a process you can’t predict with certainty—like the exact height of a randomly chosen adult or the error in a measurement. When those outcomes form a specific, symmetrical pattern around an average, you’re dealing with a normal random variable.
The defining feature is the bell-shaped curve. The highest point sits at the mean (average), and values taper off evenly on both sides. This symmetry matters because it tells us something powerful: extreme values are rare, and most outcomes live near the center.
A helpful analogy is throwing darts at a board. If you’re reasonably skilled, most darts land near the bullseye. A few land farther away, and only rarely do you miss badly. Over many throws, the pattern of distances from the center looks a lot like a normal distribution. Each dart’s distance is a random variable, and together they behave like a normal var.
Mathematically, a normal random variable is described by just two parameters:
- Mean (μ) – where the center of the distribution sits
- Standard deviation (σ) – how spread out the values are
Change the mean, and the bell curve shifts left or right. Change the standard deviation, and the curve becomes wider or narrower. Everything else about the shape stays the same. That simplicity is one reason normal vars are everywhere in statistics.
Why Normal Var Matters More Than You Think
You might be asking: Why should I care about a normal var unless I’m taking a stats exam? The answer is simple—because it’s one of the most practical tools for understanding uncertainty.
Normal random variables matter because they allow us to predict probabilities. Once you know the mean and standard deviation, you can answer questions like:
- What percentage of students scored above 80?
- How likely is a measurement to be off by more than 2 units?
- What range contains “most” values?
In real-world terms, this translates into smarter decisions. Businesses use normal vars to forecast demand and manage quality control. Doctors use them to interpret test results. Engineers rely on them to account for tolerances and errors. Even social scientists use normal distributions to model human behavior.
Another big reason normal var is so important is the Central Limit Theorem. In plain language, it says that averages of many random processes tend to become normally distributed—even if the original data isn’t. That’s why normal random variables show up everywhere, even in messy real life.
When you understand a normal var, you gain a lens for interpreting variability instead of fearing it. You stop seeing randomness as chaos and start seeing it as structure.
Benefits & Use Cases of Normal Var in the Real World
The real power of a normal var shows up when you apply it to real problems. Let’s break down where and how it’s commonly used.
Everyday and Academic Use Cases
Normal random variables appear naturally in many everyday contexts:
- Education: Exam scores often approximate a normal distribution, especially in large classes.
- Biology: Traits like height, blood pressure, and reaction time commonly follow a normal pattern.
- Manufacturing: Measurement errors and product dimensions are modeled using normal vars.
- Finance: Asset returns and price fluctuations are often approximated with normal distributions.
Practical Benefits
Using a normal var gives you several advantages:
- Predictability: You can estimate probabilities without tracking every outcome.
- Simplicity: Two parameters (mean and standard deviation) describe everything.
- Comparability: Different datasets can be compared using standardized scores.
- Decision-making: You can define thresholds, limits, and expectations with confidence.
For example, a factory might set acceptable product limits at ±3 standard deviations from the mean. That single decision, grounded in normal var logic, can reduce defects and save thousands of dollars.
In short, normal random variables turn raw data into actionable insight.
Step-by-Step Guide: How to Work With a Normal Var
Understanding theory is great, but practical steps make it stick. Here’s a clear, structured way to work with a normal var from start to finish.
Step 1: Identify the Random Variable
Start by clearly defining what you’re measuring. Ask yourself:
- Is the outcome numerical?
- Does it vary randomly?
- Could it reasonably cluster around an average?
If the answer is yes, you’re likely dealing with a candidate for a normal var.
Step 2: Check Normality (Visually and Statistically)
Before assuming normality, test it:
- Plot a histogram and look for a bell shape.
- Use a Q–Q plot to see how well data aligns with normal expectations.
- Apply normality tests like Shapiro–Wilk (when appropriate).
Real-world data doesn’t have to be perfect—approximate normality is often enough.
Step 3: Calculate Mean and Standard Deviation
These two numbers define your normal var:
- Mean tells you the center.
- Standard deviation tells you the spread.
Even rough estimates can be useful in practice.
Step 4: Standardize Using Z-Scores
Convert values into z-scores using:
z = (x − μ) / σ
This step allows you to compare different datasets on the same scale and calculate probabilities easily.
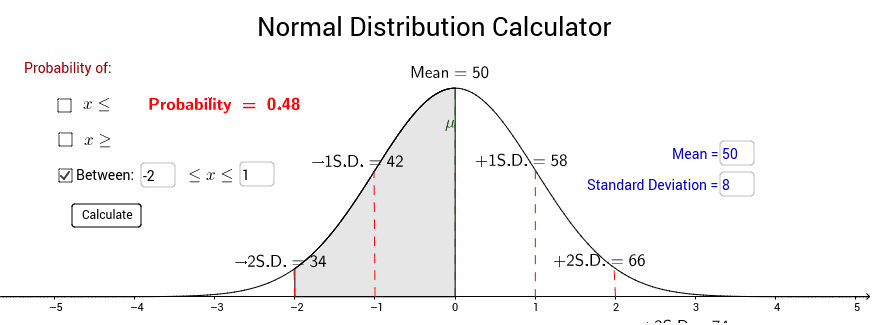
Step 5: Interpret Probabilities
Using z-scores and normal tables (or software), you can answer questions like:
- Probability of being above or below a value
- Percent of data within a range
- Likelihood of extreme outcomes
This is where normal vars turn into real decision tools.
Tools, Comparisons & Recommendations


Working with a normal var doesn’t require fancy software, but the right tools make life easier.
Free Tools
- Spreadsheet software (Excel, Google Sheets):
Great for basic calculations, histograms, and z-scores.
Pros: Accessible, visual, beginner-friendly.
Cons: Limited for advanced analysis. - Online normal distribution calculators:
Ideal for quick probability checks.
Pros: Fast and simple.
Cons: Less transparency about calculations.
Paid & Advanced Tools
- Statistical software (R, SPSS, Python):
Best for large datasets and professional analysis.
Pros: Powerful, flexible, accurate.
Cons: Steeper learning curve.
Expert Recommendation
If you’re just learning or doing light analysis, start with spreadsheets. If you’re handling serious data or research, invest time in R or Python. The concept of a normal var stays the same—the tools just change how efficiently you apply it.
Common Mistakes & How to Fix Them
Even experienced analysts stumble with normal vars. Here are the most common mistakes I’ve seen—and how to avoid them.
Assuming Normality Without Checking
Just because data looks random doesn’t mean it’s normal. Always visualize and test before assuming.
Fix: Plot first, test second, assume last.
Confusing Standard Deviation With Variance
They’re related but not interchangeable. Variance is squared units; standard deviation isn’t.
Fix: Use standard deviation for interpretation, variance for formulas.
Ignoring Outliers
Outliers can distort the mean and standard deviation, making a normal var misleading.
Fix: Investigate outliers instead of blindly deleting or ignoring them.
Overusing Normal Approximation
Some data simply isn’t normal, no matter how much we want it to be.
Fix: Know when to switch to other distributions or nonparametric methods.
Conclusion: Why Normal Var Is Worth Mastering
A normal var isn’t just a statistics concept—it’s a practical framework for understanding uncertainty. Once you see how often real-world data falls into normal patterns, you start noticing it everywhere. The beauty lies in its simplicity: two parameters, one shape, endless applications.
Whether you’re a student, analyst, researcher, or curious learner, mastering normal random variables gives you a reliable mental model for interpreting data. It helps you move beyond gut feelings and into evidence-based reasoning.
If you take one thing away from this guide, let it be this: normal vars are not about memorizing formulas—they’re about recognizing patterns and making smarter decisions. Explore them, test them, and use them as tools, not just theory.
FAQs
What is a normal var in simple terms?
A normal var is a random variable whose values follow a bell-shaped, symmetric distribution around a mean.
Why is the normal distribution so common?
Because many natural and human-made processes tend to cluster around an average, especially when influenced by many small factors.
How do I know if my data is a normal var?
Use histograms, Q–Q plots, and normality tests to check if the data approximates a normal distribution.
What is the role of standard deviation in a normal var?
Standard deviation measures how spread out the values are from the mean.
Can small datasets be normal vars?
They can, but it’s harder to verify normality with limited data.
Michael Grant is a business writer with professional experience in small-business consulting and online entrepreneurship. Over the past decade, he has helped brands improve their digital strategy, customer engagement, and revenue planning. Michael simplifies business concepts and gives readers practical insights they can use immediately.